









- Who: Nifty 50 — the benchmark index of National Stock Exchange of India, representing India’s 50 largest listed companies
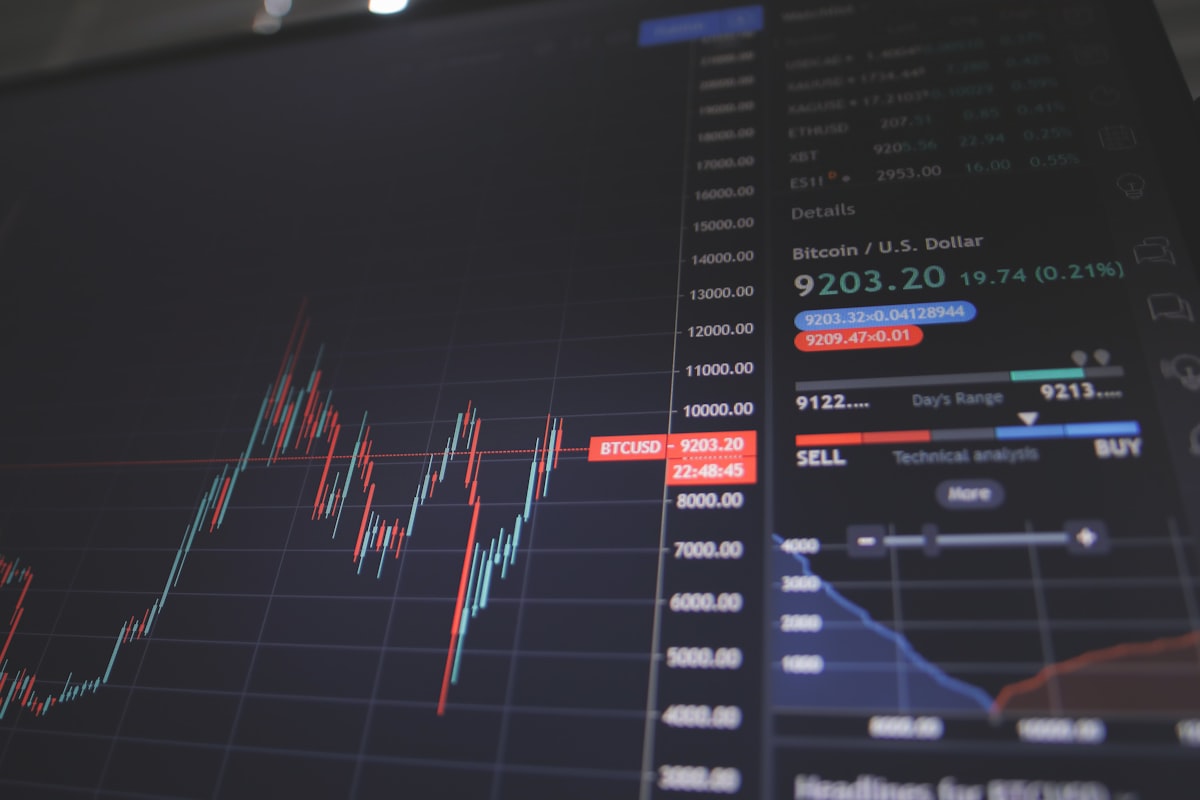
- What: Nifty 50 at 25,112, testing its highest level since October 2024 with bullish technical momentum
- When: June 2026 — analysis covering short-term (1-4 weeks) and medium-term (3-6 months) outlook
- Where: National Stock Exchange (NSE), Mumbai
- Why: Strong earnings, FII buying, RBI policy support, and global tailwinds from S&P 500 records
- Impact: If Nifty sustains above 25,000, the next target is 26,200 — a potential 4.3% gain from current levels
Key Takeaways
- Nifty 50 closed at 25,112 on June 20, 2026, up 78 points (0.31%).
- Nifty 50 is now trading above its 20-day, 50-day, and 200-day moving averages — a bullish alignment.
- Key resistance: 25,400 (short-term), 26,200 (medium-term target if rally extends).
- Key support: 24,800 (20-DMA), 24,300 (50-DMA), 23,400 (200-DMA — strong long-term support).
- Nifty 50’s P/E ratio at 22.4x forward earnings — elevated but below the 24x peak of 2021.
Nifty 50 at 25,112 is in a bullish trend with all key moving averages below the current price and a golden cross (20-DMA above 50-DMA) recently confirmed. The next resistance is at 25,400, and a sustained close above 25,400 could trigger a move to 26,200. Key support: 24,800 (20-DMA). Fundamental backdrop is positive: FII buying, strong earnings, and RBI support.
What Happened?
Nifty 50 closed June 20, 2026 at 25,112.40 — gaining 78 points (+0.31%) in the session and building on a sustained recovery that began in late April 2026. The index has now gained 14.8% year-to-date in 2026, recovering from a trough of 21,964 in February 2026 — a rebound of over 14% from the February lows in four months. The current level of 25,112 represents Nifty 50’s highest closing level since October 2024, when the index hit its all-time high of 26,277.
The structure of the June 2026 Nifty 50 rally is different from 2024’s record run. In 2024, Nifty 50 was driven to all-time highs by a narrow group of high-PE growth stocks and pre-election optimism. In 2026, the recovery is broader: banking stocks are contributing significantly (Bank Nifty is up 19.2% from February lows), IT stocks are rallying on AI deal wins, and consumption sectors including FMCG and auto are contributing positively for the first time in over a year.
Why It Matters
Nifty 50 at 25,112 matters because it places India’s benchmark index within striking distance of its all-time high of 26,277 — approximately 4.6% away. The significance of a potential new Nifty all-time high in 2026 would be considerable: it would confirm that the February 2026 correction (which briefly took Nifty below 22,000) was a bull market correction within an ongoing long-term uptrend, rather than the beginning of a structural bear market. A fresh all-time high would also attract a fresh wave of retail investor participation, which tends to amplify momentum in Indian equities.
Nifty 50 Technical Analysis
Moving Average Picture — Fully Bullish
Nifty 50’s moving average picture is unambiguously bullish in June 2026. The 20-day moving average (DMA) is at approximately 24,800 — below the current price. The 50-DMA is at 24,300 — also below the current price. The 200-DMA is at approximately 23,400. Critically, the 20-DMA crossed above the 50-DMA in mid-May 2026 — a “golden cross” signal that is used by trend-following algorithms and institutional investors as a buy signal. When all three moving averages are below the price in ascending order (20-DMA above 50-DMA above 200-DMA, all below price), this is considered the optimal bullish alignment in technical analysis.
Nifty 50 RSI and Momentum
The 14-day Relative Strength Index (RSI) for Nifty 50 is at 61 on June 20, 2026. RSI above 50 signals positive momentum; RSI above 70 signals overbought conditions. At 61, Nifty has significant room to run before becoming technically overbought — suggesting that the current rally has momentum but is not yet at an exhaustion point. The MACD (Moving Average Convergence Divergence) indicator is positive and widening — a sign that upside momentum is building rather than decelerating.
Fundamental Backdrop
Earnings Season Supporting Nifty 50
The FY26 Q4 earnings season (January–March 2026 results, reported April–May 2026) was broadly positive for Nifty 50 constituents. Aggregate Nifty 50 earnings beat analyst estimates by 6.2% — the third consecutive quarter of positive earnings surprise. Banking sector earnings were particularly strong: HDFC Bank reported 18.4% profit growth, ICICI Bank reported 16.2%, and SBI reported 21.7% — all above estimates. IT sector results were mixed, with Infosys and HCL Technologies beating estimates while TCS and Wipro were broadly in line. Consumer staples saw a recovery in volume growth after three quarters of weakness, driven by improving rural demand.
FII Flow Outlook
FIIs have net bought ₹28,000 crore in Indian equities in June 2026 — the strongest monthly buying pace since November 2023. The primary drivers are: India’s macro stability (GDP growth of 7.6% in FY26, current account deficit contained at 1.1% of GDP), the RBI’s accommodative monetary stance with the repo rate at 5.25% (down 75 basis points from the 6% peak), and India’s inclusion in multiple global bond indices which has attracted fixed-income capital alongside equity capital. Continued FII buying at current levels would provide significant support for Nifty 50 through Q3 2026.
Frequently Asked Questions
What is the target for Nifty 50 in 2026?
Based on technical and fundamental analysis, Nifty 50’s near-term resistance is at 25,400, and a sustained close above that level would open a medium-term target of 26,200 — slightly below the all-time high of 26,277. Several brokerages have issued 12-month Nifty 50 targets in the range of 26,500–28,000, based on projected FY27 earnings growth of 12–15% and a P/E multiple of 21–22x. These are analyst projections, not guarantees.
What is the Nifty 50 support level in June 2026?
The key Nifty 50 support levels in June 2026 are: 24,800 (the 20-day moving average — near-term support), 24,300 (the 50-day moving average — medium-term support), and 23,400 (the 200-day moving average — strong long-term support that has held on every significant correction since 2020). A close below 23,400 would be considered a significant technical breakdown and would likely attract institutional selling.
Is it a good time to invest in Nifty 50 in June 2026?
Nifty 50 at 25,112 trades at approximately 22.4x forward earnings — above the long-run historical average of 17–18x. This means the index is not cheap by historical standards. However, India’s growth premium versus other major economies justifies some valuation premium. For long-term investors with a 5-year+ horizon, current Nifty 50 levels may offer reasonable entry opportunities, particularly through SIP (systematic investment plan) routes that average out short-term volatility. Short-term traders should note that the 25,400 resistance level is critical — a break above would be bullish, while a rejection at 25,400 could lead to a retest of 24,800 support.
Conclusion
Nifty 50’s June 2026 position — at 25,112, with all moving averages aligned bullishly, a golden cross confirmed, RSI at 61, strong FII buying, and earnings season beats — presents a technically and fundamentally positive picture for India’s benchmark equity index. The path of least resistance is toward 25,400–26,200 if global markets remain supportive and FII flows continue. The key risks are a reversal in global risk sentiment (driven by US data surprises or geopolitical shocks) or domestic earnings disappointments in Q1 FY27. For investors tracking Nifty 50, the 24,800 level (20-DMA) is the immediate line in the sand — a sustained hold above it keeps the bullish thesis intact.
Sources
- NSE India: Nifty 50 Index Data June 2026
- SEBI: FII/FPI Monthly Investment Data
- Moneycontrol: Nifty 50 Earnings Scorecard FY26 Q4
This article is for informational purposes only and does not constitute financial or investment advice.